Top all-time · #6472

Cambridge Intelligence
Company blog · cambridge-intelligence.com/blogprogrammingdata
Cambridge Intelligence is the company blog at cambridge-intelligence.com, writing about programming and data. Since 2015, 12 different Hacker News readers have linked it 16 times, most often “Graph visualization: fixing data hairballs – Cambridge Intelligence”. No feed was found, so read it on the site itself.
Too few sampled comments (8) to say how often HN recommends it.?
Why HN links it
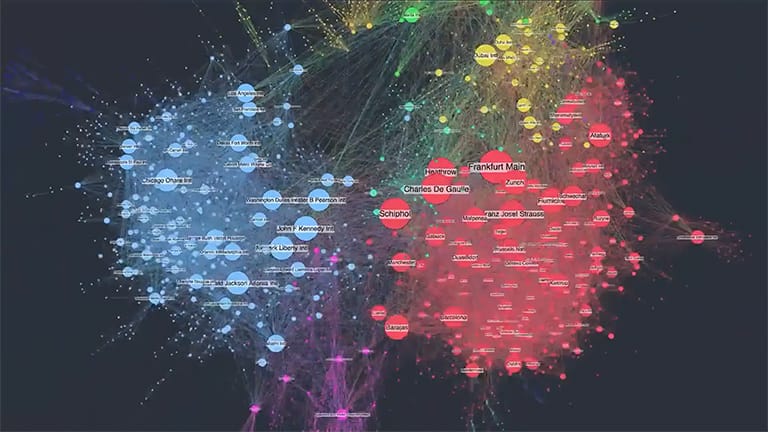
Commenters cite the 'how-to-fix-hairballs' post, about making large graph visualizations readable, to support claims that dense network diagrams are incomprehensible. Other comments are a job ad and graph-tool discussion.
Summarised by Claude from a sample of 8 HN comments that link here. Each comment is marked recommending, critical or neutral (citing without judging); how this works.
Transform connected data into interactive visualizations with data visualization SDKs proven to perform in mission-critical software.
Most-linked posts?
- Graph visualization: fixing data hairballs – Cambridge Intelligence4 people · 6 mentions · first linked 2022-04-14
- Can graph theory predict the World Cup winner?2 people · 2 mentions · first linked 2018-07-09
What Hacker News says?
Cambridge Intelligence | JavaScript Developer | Full time, on-site, Cambridge, UK At Cambridge Intelligence we build tools for visualising complex connected data (graph data) in the browser. Our product is KeyLines - a JavaScript SDK for graph visualization: http://keylines.com . We’re looking for JavaScript engineers with at 2-3 years experience and a strong grasp of the fundamentals of software development. You wi…
Comment linking /careers/vacancies/
on “Ask HN: Who is hiring? (August 2015)”Submitted Can graph theory predict the World Cup winner? as a story · 4 points
HN discussionI'm mildly skeptical of visual programming because code generally won't be a planar graph and it's rarely useful to visualize a complicated enough graph. You can try to embed the graph in hyperbolic space, but I'm not sure how much you get out of it. For example of visualizing a graph where it's not clear what's going on: https://cambridge-intelligence.com/wp-content/uploads/2021/0... Coding is a logic/language type…
Comment linking /wp-content/uploads/2021/09/poster.jpeg
on “It's hard to write code for computers, but it's harder to write code for humans”Submitted Visualizing Donald Trump’s network as a story · 3 points
HN discussionEven if you can calculate the layout for a very large DAG in a reasonable time, the zooming and scrolling required as a user to make sense of it and follow interesting paths makes it unwieldy in my experience. One approach to use with very large DAGs is to interactively expand / collapse nodes - for a simple tree example imagine something like a treeview control for browsing a file system, expanding folders of inter…
Comment linking /keylines/layouts/
on “D3-dag – Layout algorithms for visualizing directed acylic graphs”Submitted Graph eigencentrality FIFA world cup predictions as a story · 1 points
HN discussionPeople still upvote hairball graphs every time. Fortunately there is a cure: https://cambridge-intelligence.com/how-to-fix-hairballs/
Comment linking /how-to-fix-hairballs/
on “Network visualization of 50k blogs and links”Submitted Graph visualization: fixing data hairballs – Cambridge Intelligence as a story · 1 points
HN discussionYeah I used cytoscape before but it didn't have the full customization that I wanted. Besides the performance issues, there were some problems I couldn't have solved without a custom renderer - if many lines overlap, how should their colors blend? - how to render circles so that they look nice both zoomed in / out - how to avoid it looking like a hairball graph [1] The nice thing about a personal project is that I c…
Comment linking /how-to-fix-hairballs/
on “Network visualization of 50k blogs and links”Submitted Using Graph Theory to predict FIFA World Cup winners with minimal data as a story · 1 points
HN discussionAs someone working on such a visualization product ... it's complex ... and often the wrong question. While you can envision ways of laying out and rendering such large graphs (force-directed layout is frequent, as are hardware-accelerated rendering methods that typically only show nodes with size and color, but little more complex than that), you don't just want to stare at a pretty hairball. Graphs have structure,…
Comment linking /how-to-fix-hairballs/
on “Ask HN: What is the best software to visualize a graph with a billion nodes?”Submitted Can graph theory predict the World Cup winner? as a story · 1 points
HN discussionThis package was designed to solve more problems than it creates https://github.com/paulhoule/gastrodon Overall I think of graph visualization as a problem, in particularly there are some people who just don't see that hairballs are incomprehensible https://cambridge-intelligence.com/how-to-fix-hairballs/
Comment linking /how-to-fix-hairballs/
on “LinkedDataHub: The Knowledge Graph Notebook”At scales far below what you're talking about people experience grave difficulties making sense of big graphs. https://cambridge-intelligence.com/how-to-fix-hairballs/ One of my favorite examples is this guy https://en.wikipedia.org/wiki/Mark_Lombardi I saw an art exhibit that showed some of the sketches that he made and it was clear that he worked really hard drawing and redrawing each graph and they went from bein…
Comment linking /how-to-fix-hairballs/
on “Ask HN: Tools for exploratory analysis of 10-100GB graphs”