Top all-time · #4101
Darkhorse Analytics
Company blog · darkhorseanalytics.com/blogdatadesign
Darkhorse Analytics is the company blog at darkhorseanalytics.com, writing about data and design. Since 2013, 19 different Hacker News readers have linked it 20 times, most often “Data looks better naked”. No feed was found, so read it on the site itself.
Too few sampled comments (7) to say how often HN recommends it.?
Why HN links it
HN readers link Darkhorse Analytics' posts on designing data tables and charts, such as 'Data Looks Better Naked' and 'Clear Off the Table'. They are valued for clear, condensed advice on presenting data visually.
Summarised by Claude from a sample of 7 HN comments that link here. Each comment is marked recommending, critical or neutral (citing without judging); how this works.
Discover Darkhorse Analytics, home to Darkhorse Visualization and Darkhorse Emergency. From data storytelling to public safety insights, we turn research into decisions that drive impact.
Most-linked posts?
- Data looks better naked5 people · 5 mentions · first linked 2013-09-24
- /blog/clear-off-the-table2 people · 2 mentions · first linked 2022-09-14
What Hacker News says?
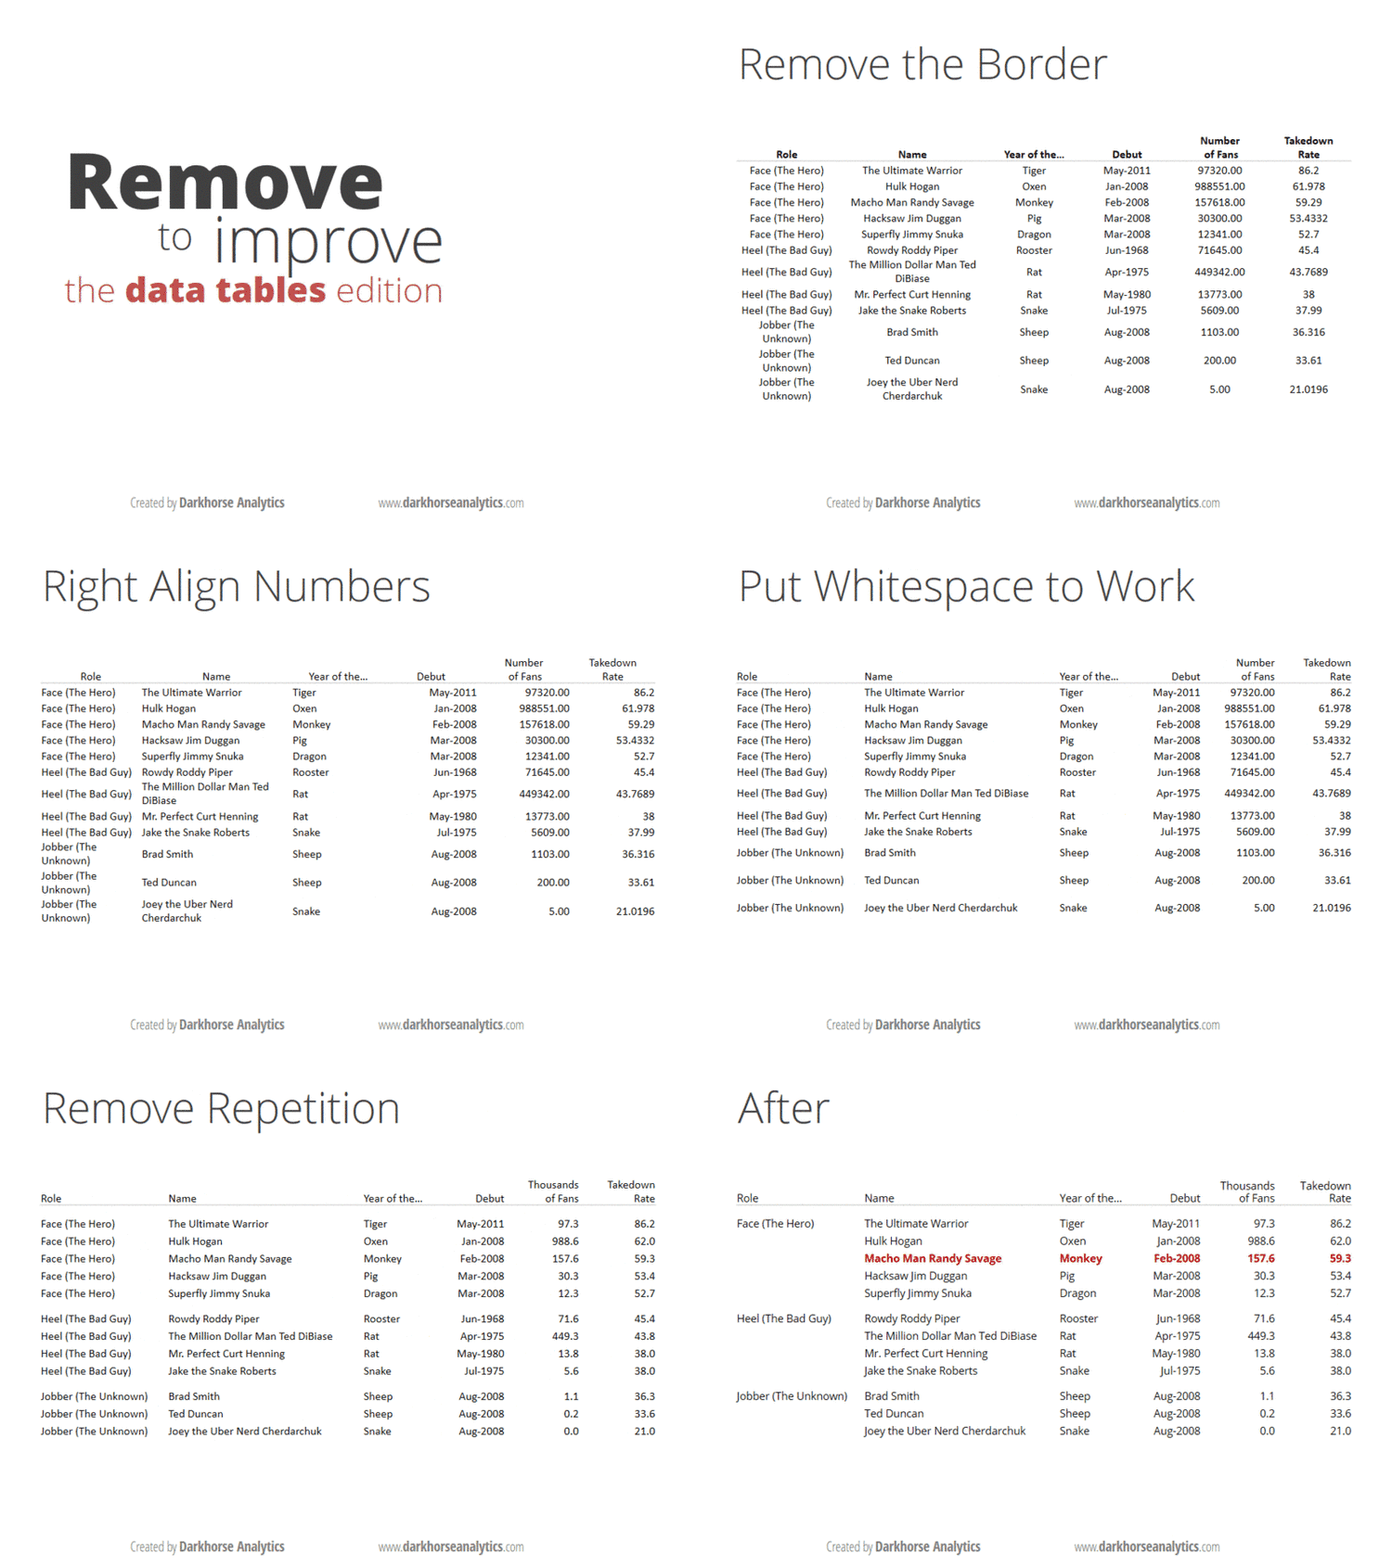
This mini presentation goes around sometimes: https://www.darkhorseanalytics.com/blog/clear-off-the-table
Comment linking /blog/clear-off-the-table
on “The design philosophy of Great Tables”Submitted Data looks better naked as a story · 172 points
HN discussionBest presentation of your point I've seen: http://www.darkhorseanalytics.com/blog/data-looks-better-nak...
Comment linking /blog/data-looks-better-naked/
on “What you should know as a founder of a software company”Submitted Breathing City as a story · 4 points
HN discussionhaven't used splunk, but IIRC, they focus on logging. Tableau is a better comparison. They (like excel) are the "do everything" solution. Meaning that if you want to change/tweak a chart or come up with a new chart type, you can. But most people don't know how to do that effectively and you can shoot yourself in the foot more easily. Machete is geared towards doing only a few things, but knocking them out of the par…
Comment linking /blog/data-looks-better-naked/
on “Ask HN: What projects are you working on?”Submitted Visualizing Distributions as a story · 3 points
HN discussionThe original source with blog post: http://darkhorseanalytics.com/blog/data-looks-better-naked/
Comment linking /blog/data-looks-better-naked/
on “Data looks better naked”Submitted Data looks better naked as a story · 3 points
HN discussionI'm fond of the condensed way similar advice is presented here: https://www.darkhorseanalytics.com/portfolio/2016/1/7/data-l...
Comment linking /portfolio/2016/1/7/data-looks-better-naked-clear-off-the-table?rq=tables
on “Small guide to making nice tables [pdf]”Submitted Naked pie charts (2016) as a story · 2 points
HN discussionData Looks Better Naked: Clear Off the Table - https://www.darkhorseanalytics.com/blog/clear-off-the-table
Comment linking /blog/clear-off-the-table
on “Demystifying tables (cells inside; borders outside)”Submitted Data looks better naked as a story · 2 points
HN discussionGreat GIF of these concepts: http://www.darkhorseanalytics.com/portfolio/2016/1/7/data-lo...
Comment linking /portfolio/2016/1/7/data-looks-better-naked-clear-off-the-table
on “Design better data tables”Submitted Salvaging the Pie (2014) as a story · 1 points
HN discussionSubmitted Breathing City: Manhattan Works and Sleeps as a story · 1 points
HN discussionSubmitted Salvaging the Pie as a story · 1 points
HN discussionSubmitted Visualizing Distributions as a story · 1 points
HN discussionSubmitted Clear Off the Table as a story · 1 points
HN discussionSubmitted Clear Off the Table: How to improve the readability of data tables as a story · 1 points
HN discussionSubmitted Remove to Improve (The Data-Ink Ratio) as a story · 1 points
HN discussion