Top all-time · #9335

Lisa Charlotte Muth
Personal blog · lisacharlotterost.github.iodatadesignculture
Lisa Charlotte Muth's personal blog at lisacharlotterost.github.io covers data, design and culture. Since 2015, 8 different Hacker News readers have linked it 15 times, most often “The Line Between Data Vis and Data Art”. It is still writing: the last post was on 2026-03-11, and you can follow it by feed.
Too few sampled comments (6) to say how often HN recommends it.?
Why HN links it
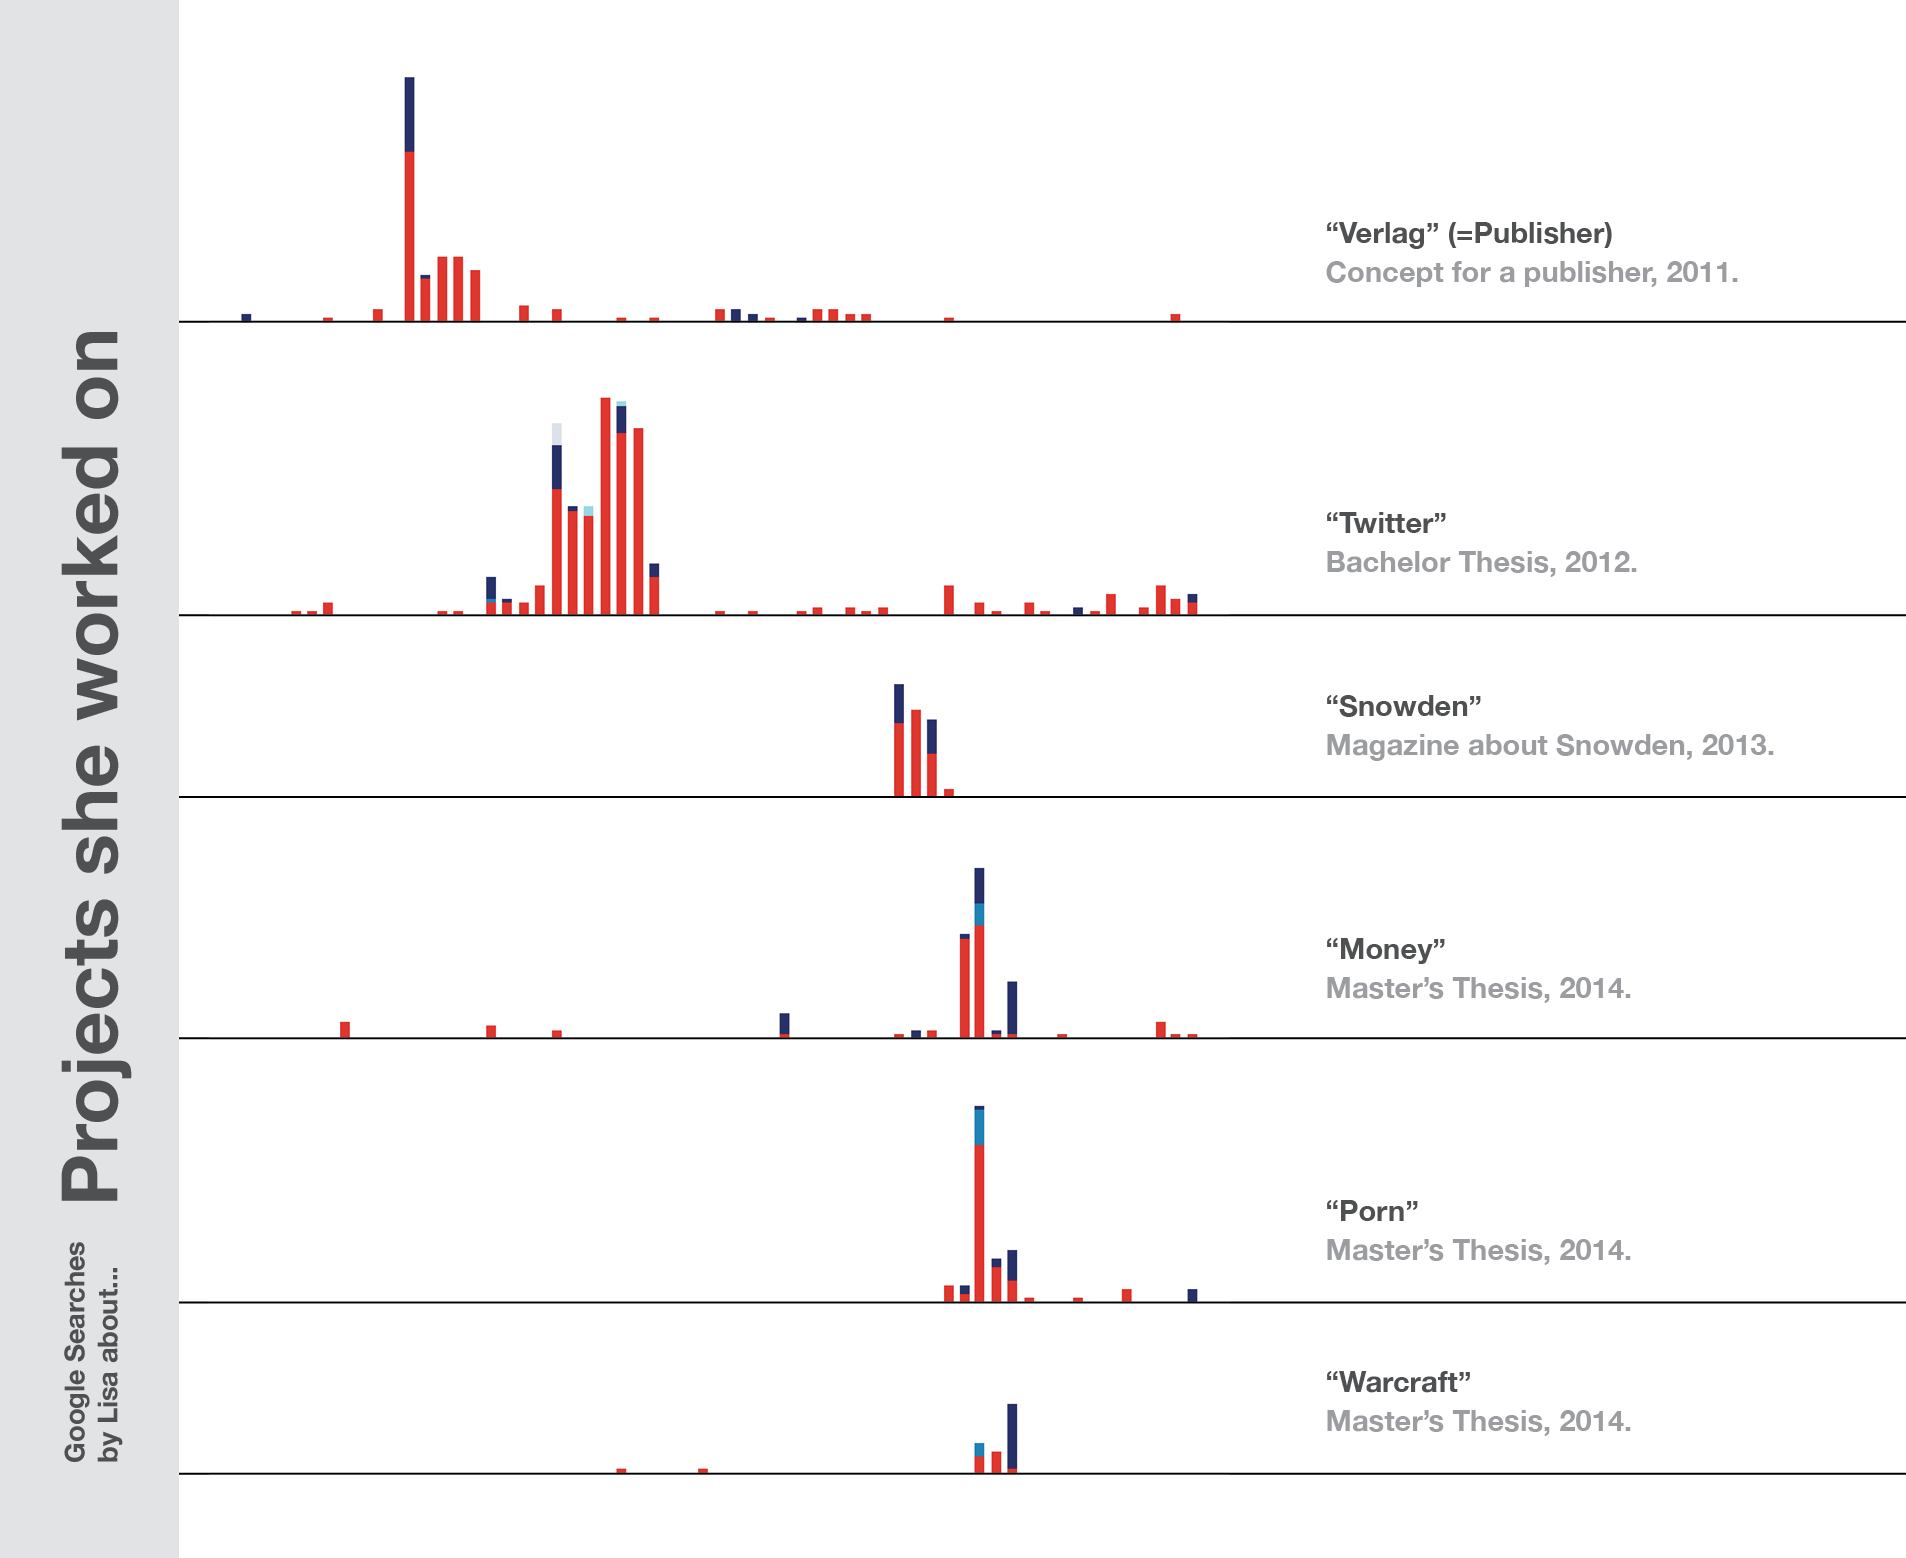
HN readers link Lisa Charlotte Muth's blog for data visualization writing: the line between data vis and data art, a comparison of twelve charting tools, and a visualization of a Google search history.
Summarised by Claude from a sample of 6 HN comments that link here. Each comment is marked recommending, critical or neutral (citing without judging); how this works.
Most-linked posts?
- The Line Between Data Vis and Data Art2 people · 2 mentions · first linked 2015-12-15
- One Chart, Twelve Charting Tools2 people · 2 mentions · first linked 2016-05-18
What Hacker News says?
Think this might be the article you're looking for; figured I'd throw a link out in case it was: http://lisacharlotterost.github.io/ Was posted recently. Comments: https://news.ycombinator.com/item?id=10737876
Comment linking /
on “Introducing d3-scale”Submitted One Chart, Twelve Charting Libraries as a story · 212 points
HN discussionHi there, thanks so much! I also tried 12 applications for data vis here; including Tableau: http://lisacharlotterost.github.io/2016/05/17/one-chart-tool...
Comment linking /2016/05/17/one-chart-tools/
on “One Chart, Twelve Charting Libraries”Submitted Strong beliefs, loosely held as a story · 47 points
HN discussionA beautiful piece of data art (as in https://lisacharlotterost.github.io/2015/12/19/Meaning-and-B... ), but not much of a data visualization (I can hardly get any insight from it).
Comment linking /2015/12/19/Meaning-and-Beauty-in-Data-Vis/
on “Marching neural network”Submitted The Line Between Data Vis and Data Art as a story · 37 points
HN discussionI mean come on, is an article with pictures such as: https://lisacharlotterost.github.io/pic/170509_Republica_Tal... worth discussing? What's next, the right-wing field sharing articles of IQ across racial groups?
Comment linking /pic/170509_Republica_Talk84.png
on “Strong beliefs, loosely held”Submitted My Google Search History Visualized as a story · 37 points
HN discussionActual link to this blog post (not just the blog) is: http://lisacharlotterost.github.io/2015/12/14/The-Line-betwe... (in any case, a nice reading!)
Comment linking /2015/12/14/The-Line-between-Data-Vis-And-Data-Art/
on “The Line Between Data Vis and Data Art”Submitted Why US election maps should show both the popular and the electoral votes as a story · 3 points
HN discussionShe wont be fooling anyone with her porn searches for her "thesis" http://lisacharlotterost.github.io/pic/150620_GoogleSearch_8...
Comment linking /pic/150620_GoogleSearch_8.jpg
on “My Google Search History Visualized”Submitted My Google Search History Visualized as a story · 3 points
HN discussionSubmitted How Feel When I Have a Conversation as a story · 2 points
HN discussionSubmitted One Chart, Twelve Charting Tools as a story · 2 points
HN discussionSubmitted Which Cities Are on Similar Latitudes? as a story · 1 points
HN discussion